


A climate normal is an average of weather variables, like temperature and precipitation, over a certain timeframe, meant to inform stakeholders and the public on what climate conditions are like during a certain time of year. These averages and statistics are calculated so we can put the weather into proper context and make better climate-related decisions. But normals are not merely averages of raw data. Rather, 30 years of U.S. weather station observations are compiled, checked for quality, compared to surrounding stations, filled in for missing periods, and used to calculate not only averages but many other measures. The NCEI (National Centers for Environmental Information) and its predecessors have been the official source for U.S. climate normals since the 1950s. On May 4, 2021, NOAA released the 1991 – 2020 new climate normals, of which two-thirds of the data overlap with the previous version (1991 – 2020 versus 1981 – 2010). You can think of these climate “updates” as the equivalent of the Census for those who use the data.
Climate warming has occurred all across the state of Alaska, with the most significant warming along the North Slope, the Arctic Coast and the adjacent Arctic Ocean from the Beaufort to the Chukchi Sea. This is tied to the distinct changes in the extent of sea ice: there has been significantly less sea ice in recent years, with historic lows recorded in the Bering Sea. In Alaska, the normal temperature has risen nearly 1 degree Fahrenheit since the 1981 – 2010 period. Fairbanks is no longer considered a sub-Arctic climate, instead termed a “warm summer continental” climate due to May now having an average temperature above 50 degrees Fahrenheit.
Yes, mean annuals can be found on our time series data page.
Yes, under our “data” tab, you can navigate to time series data, where you can download data on seasonal and monthly snowfall totals.
The Alaska Climate Research Center is involved with the CoCoRaHS citizen science project. The Community Collaborative Rain, Hail and Snow (CoCoRaHS) Network is a non-profit community-based network of volunteers that measure and map precipitation nationally using low-cost measurement tools such as rain gauges, hail pads and home-built snow boards. For the first time, precipitation normals have been created for more than 770 Snow Telemetry (SNOTEL) stations managed by the U.S. Department of Agriculture and for more than 5,400 citizen science observation stations from the Community Collaborative Rain, Hail, and Snow (CoCoRaHS) Network. Data can be sourced here.
Record high and low temperatures can be found under “climate extremes.”
To view historical data on our webpage, navigate to the data portal to choose your weather station, variables of interest, and date range of interest. The portal not only displays the data, but gives you the option to download the data as a csv file.
Yes, you can find this under our “data” tab, or use this link to navigate straight there.
Yes, under our data tab, you can navigate to any of the following: data portal, climate normals, time series data and climate extremes. From there, click on what interests you, choose the weather station, variables of interest and date range. An option to download csv files appears after you make these selections.
For more information on growing, heating and freezing degree days, navigate to our climate normals page under the data tab and choose the data of interest. From there, you can specify the weather station, variables of interest, and date range of interest.
Yes, the Alaska Climate Research Center weather station is located on the roof of the Geophysical Institute at the University of Alaska in Fairbanks (Map A). The station is located at 737 feet (225 m) above sea level, at 64°51’33.28″N, 147°51’2.88″W. By comparison, the official National Weather Service reporting station is located at the Fairbanks International Airport (Map B). The elevation is 436 feet (133 m) and lies at 64°48’13.98″N, 147°52’33.98″W. This is a difference of 2.8 miles and 301 feet in elevation from the NWS Station. If you’re comparing data between the two stations, you may notice a higher temperature at the ACRC station than at the official NWS station during the winter months. This is due to a higher frequency of temperature inversions during the winter season. To provide a better idea of the station location, see the map below of the UAF West Ridge. As the ACRC Station is located on top of an 8-story building, it is susceptible to local wind and temperature effects, and should not be considered as an “official” reporting station.
Map A: Location (red marker) of the UAF meteorological station.

Map B: Locations of UAF and Fairbanks International Airport meteorological stations.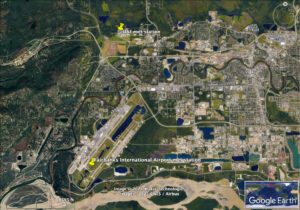
Read more about fire activity and smoke emissions on our Smoke page.
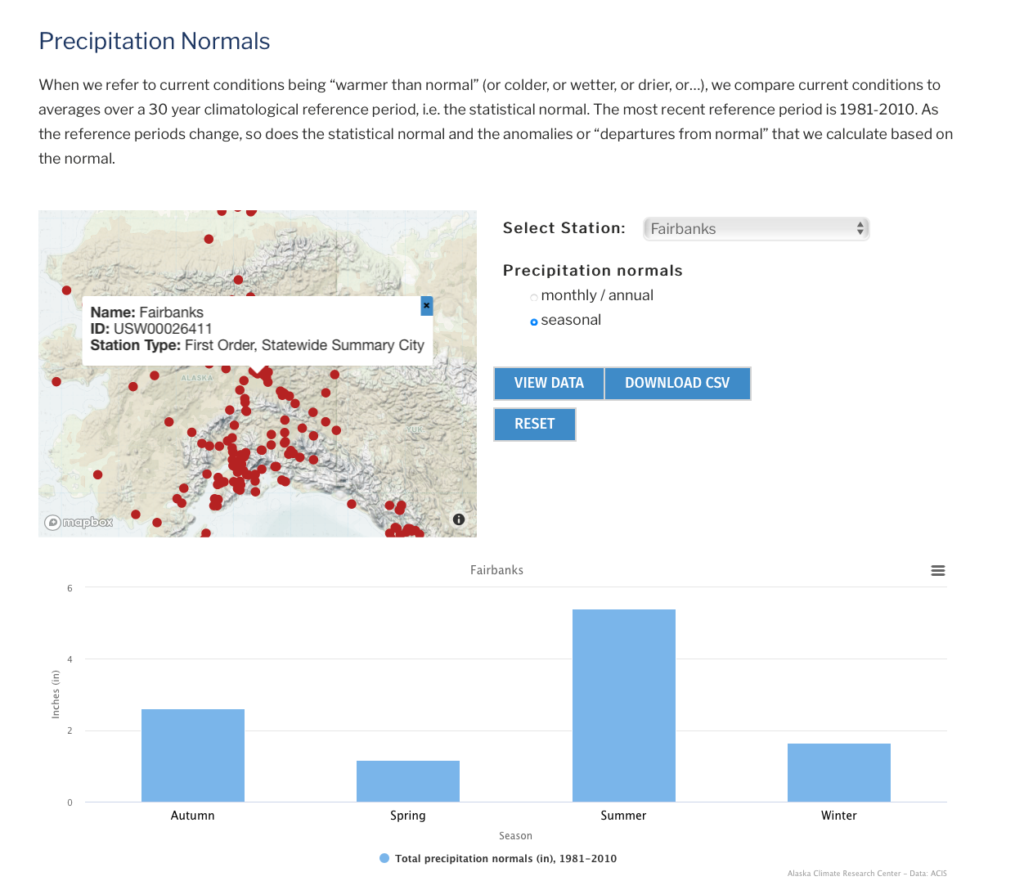
Before your trip, have a look at the current and 10-day forecast for your destination city, to get an idea of what to expect for your visit. Given you’re likely planning your trip weeks to months in advance, you can get more information on what to expect by having a look at our data on temperature and precipitation historical averages, or, normals. You can think of normals like a “ruler” to compare today’s weather and tomorrow’s forecast, and as a predictor of conditions in the near future. Using Fairbanks as an example from our data portal, if you’re planning a trip in July, the average temperature is 62.5 F (minimum: 52.3 F, maximum: 72.7 F), and the total precipitation is 2.16 inches. You also have the option to choose “seasonal” normals for your region of interest. Again, using Fairbanks as an example, total precipitation for the summer is 5.41 inches (see image below – which shows this is the wet season in Fairbanks) while seasonal (summer) temperatures in Fairbanks are 59.7 F (average), 70 F (maximum) and 49.3 (minimum). If summer in Fairbanks is like spring at your home, then bring clothes you find comfortable for this type of weather.
Yes! In Fairbanks, Alaska, the viewing “season” is from August 21 – April 21. At other times, the sky doesn’t get dark enough. In other locations in Alaska, it depends on the latitude – look for when the skies are darkest and clearest, which would be the wintertime at the high northern latitudes. To see the current aurora forecast, navigate here.

Check out our Tourist Information page, where we have graphs showing the sunrise and sunset times for several locations in the state (adjust for daylight savings time ahead one hour from the first week in April until the last week in October).
Back in the 1970s, Dr. Jim Anderson, a University of Alaska Fairbanks professor started collecting data on when the trees and shrubs started to turn green (sprout) in Fairbanks, Alaska. He defined it as “birch and aspen leaves open just enough to produce a faint but distinct green flush through the forest canopy.” Apart from how it changes the landscape, this greening up has important climate considerations. Once the leaves come out, they can transpire moisture to the atmosphere. Though records don’t exist for the rest of the state, this process is highly temperature dependent. Given the Interior warms up the fastest, generally greening up is going to occur in the central part of the state faster than other places. The most recent green-up date was May 9, 2021. Since data collection began in 1974, the average date is May 8.
Alaska’s north coast is predominantly erosional, averaging a loss of 1.4 meters a year. Along a much smaller stretch (60 km) of this coastline, average annual erosion rates doubled from historical levels of about 20 feet per year between the mid-1950s and late-1970s, to 45 feet per year between 2002 and 2007. The change in erosion rates is likely the result of several changing Arctic conditions, including declining sea-ice extent, increasing summertime sea-surface temperature, rising sea level, and possible increases in storm power and corresponding wave action.
Please send us a message at uaf-climate@alaska.edu