Alaska Climate Research Center

The Alaska State Climate Center
Home > Departure Maps > September 2020

Maps: September 2020

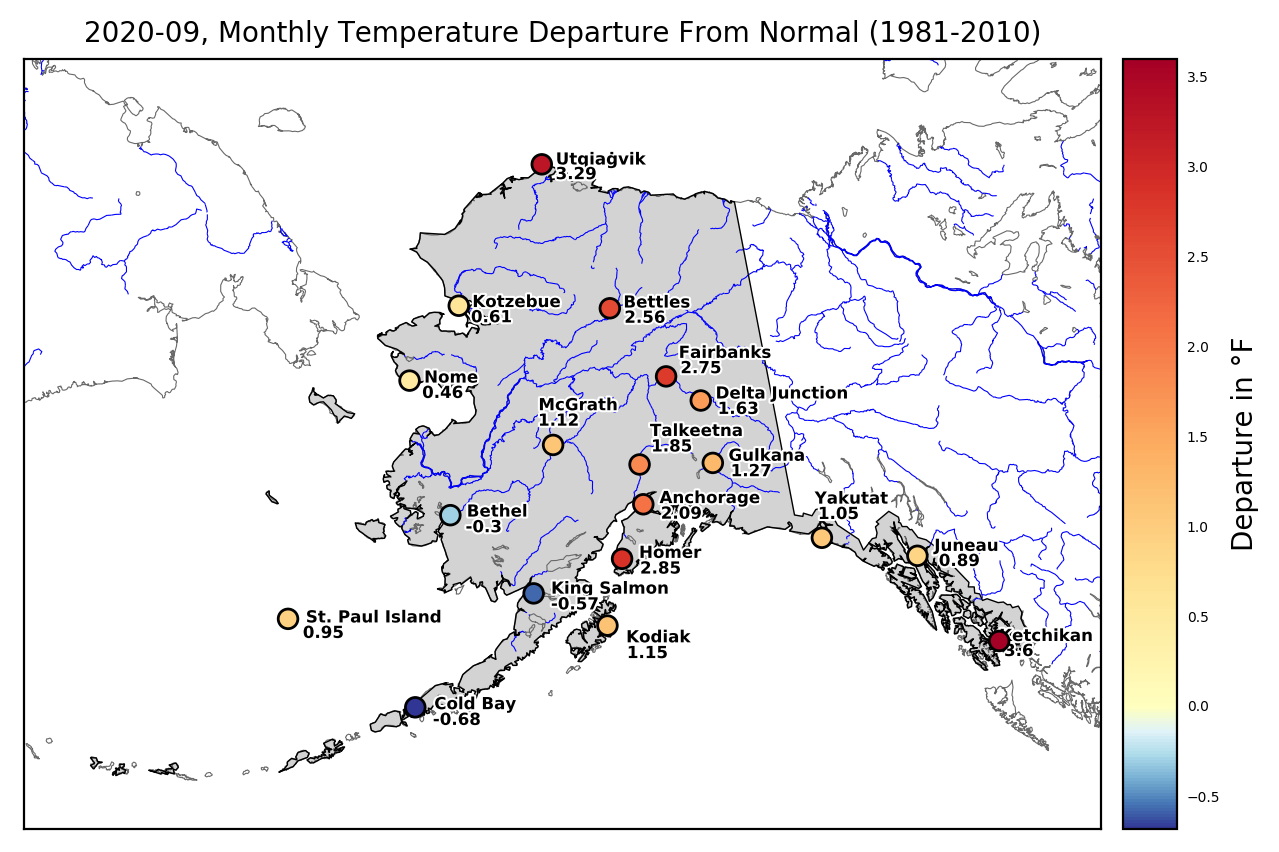
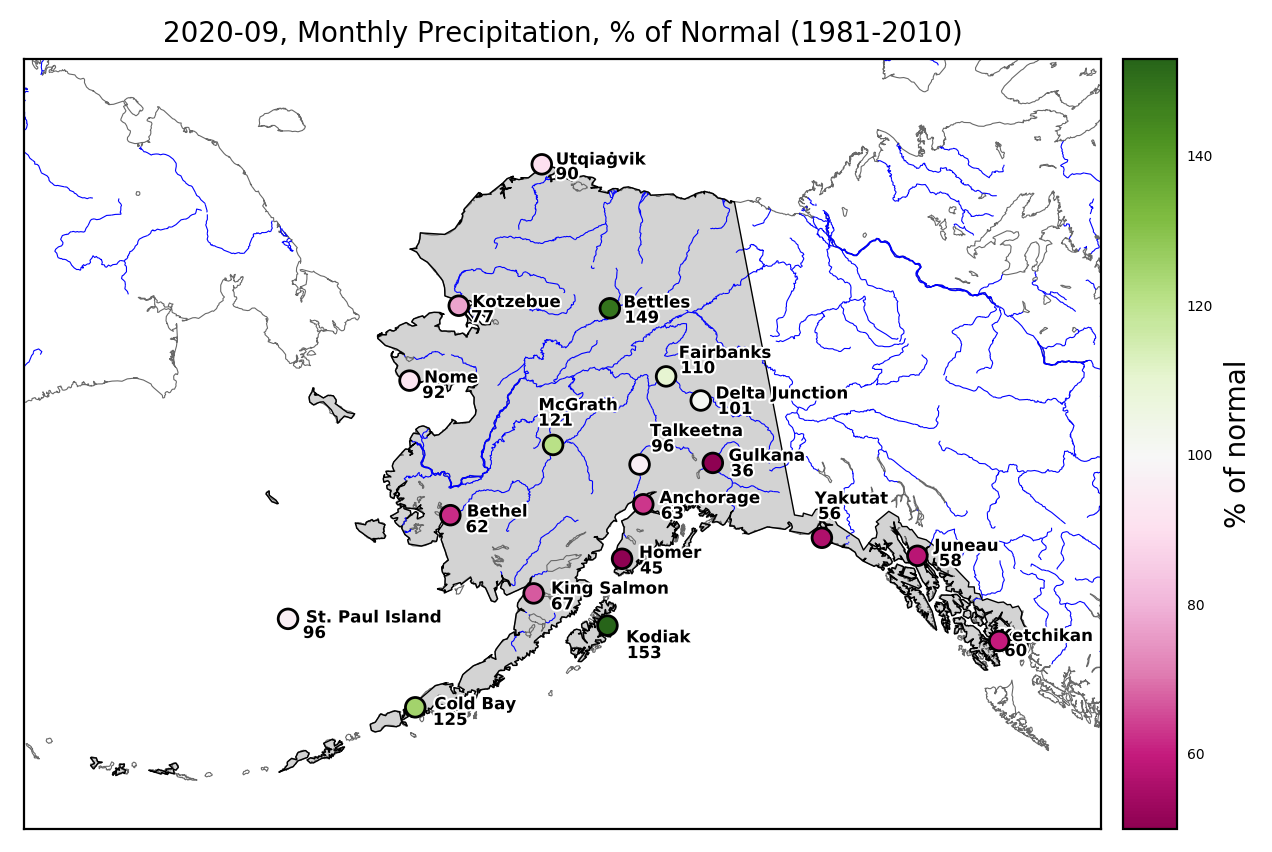
Departure from normal (where normal is 1981 - 2010) maps of temperature and precipitation for selected stations around the state of Alaska.

  • Temperature: shades of blue indicate cooler than normal while shades of yellow and red indicate warmer than normal.
  • Precipitation: shades of purple indicate drier than normal while shades of green indicate wetter than normal.
temp departure map
Monthly mean temperature departure from normal, September 2020.
temp anomaly map
WeatherWise temperature anomaly map for September 2020.
precip departure map
Monthly precipitation sums expressed as percent of
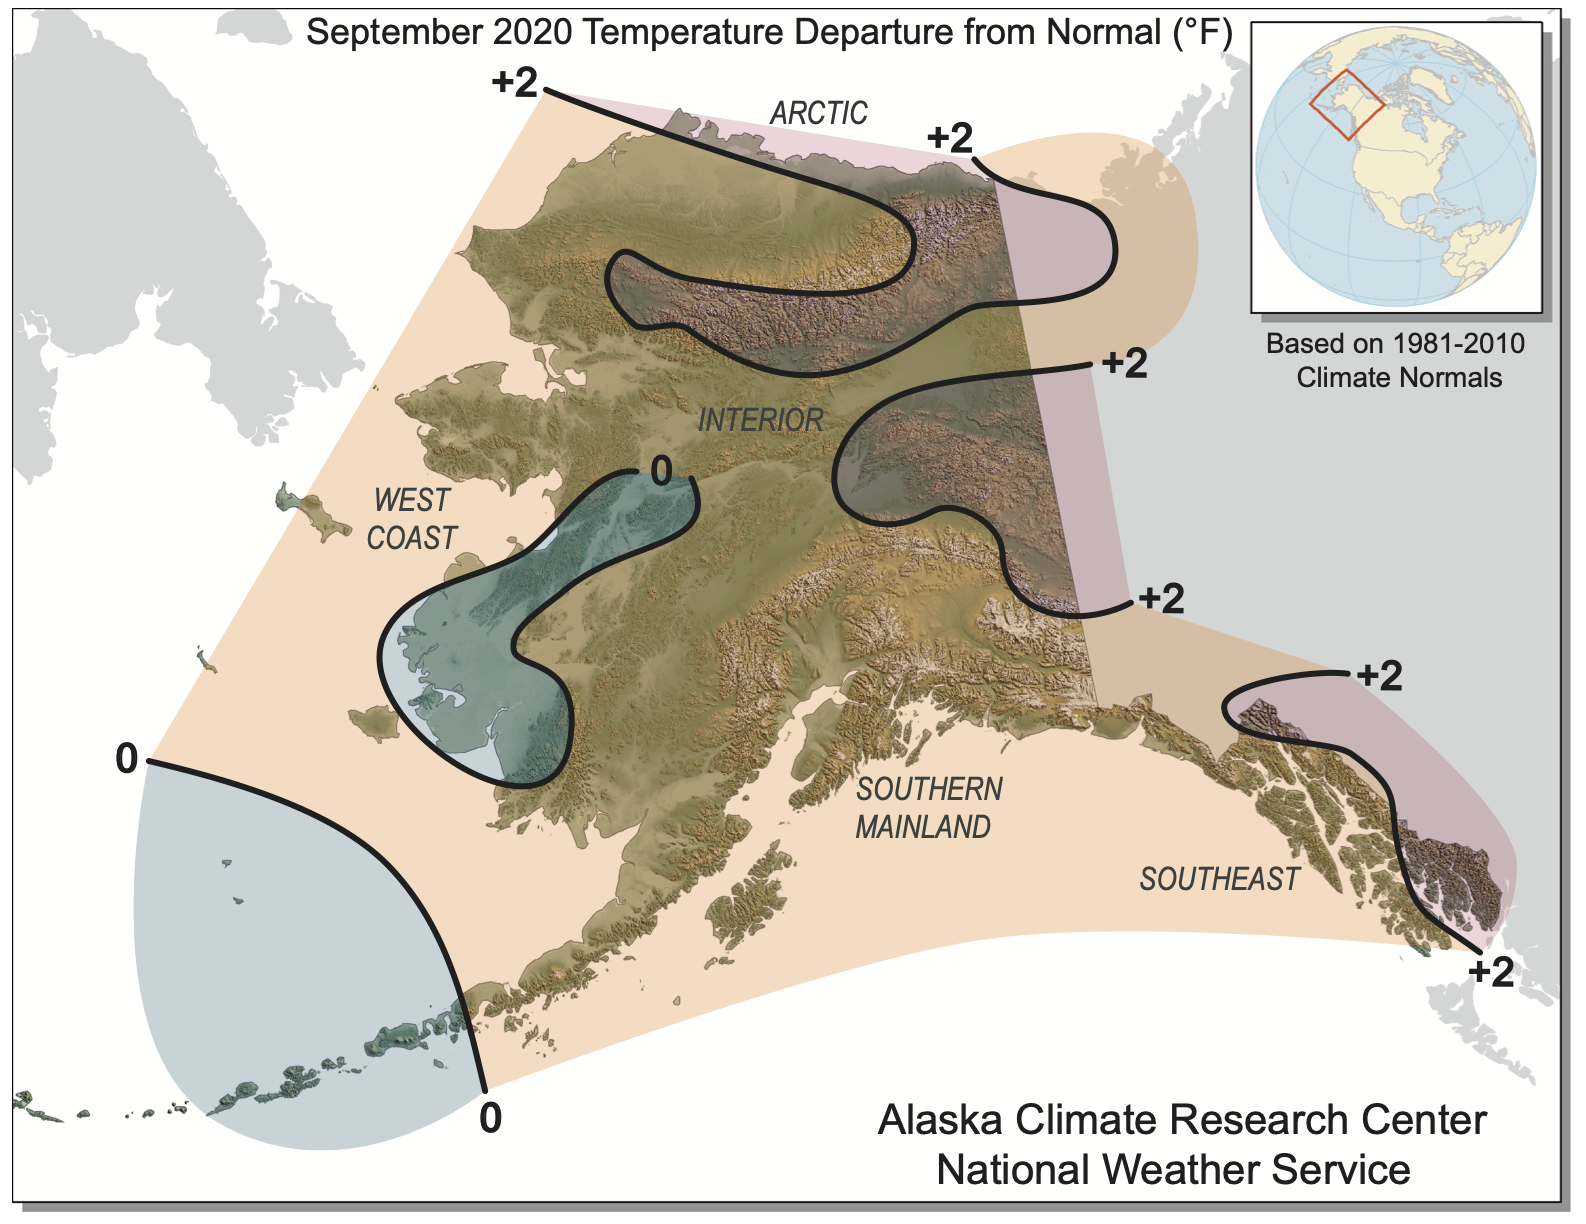
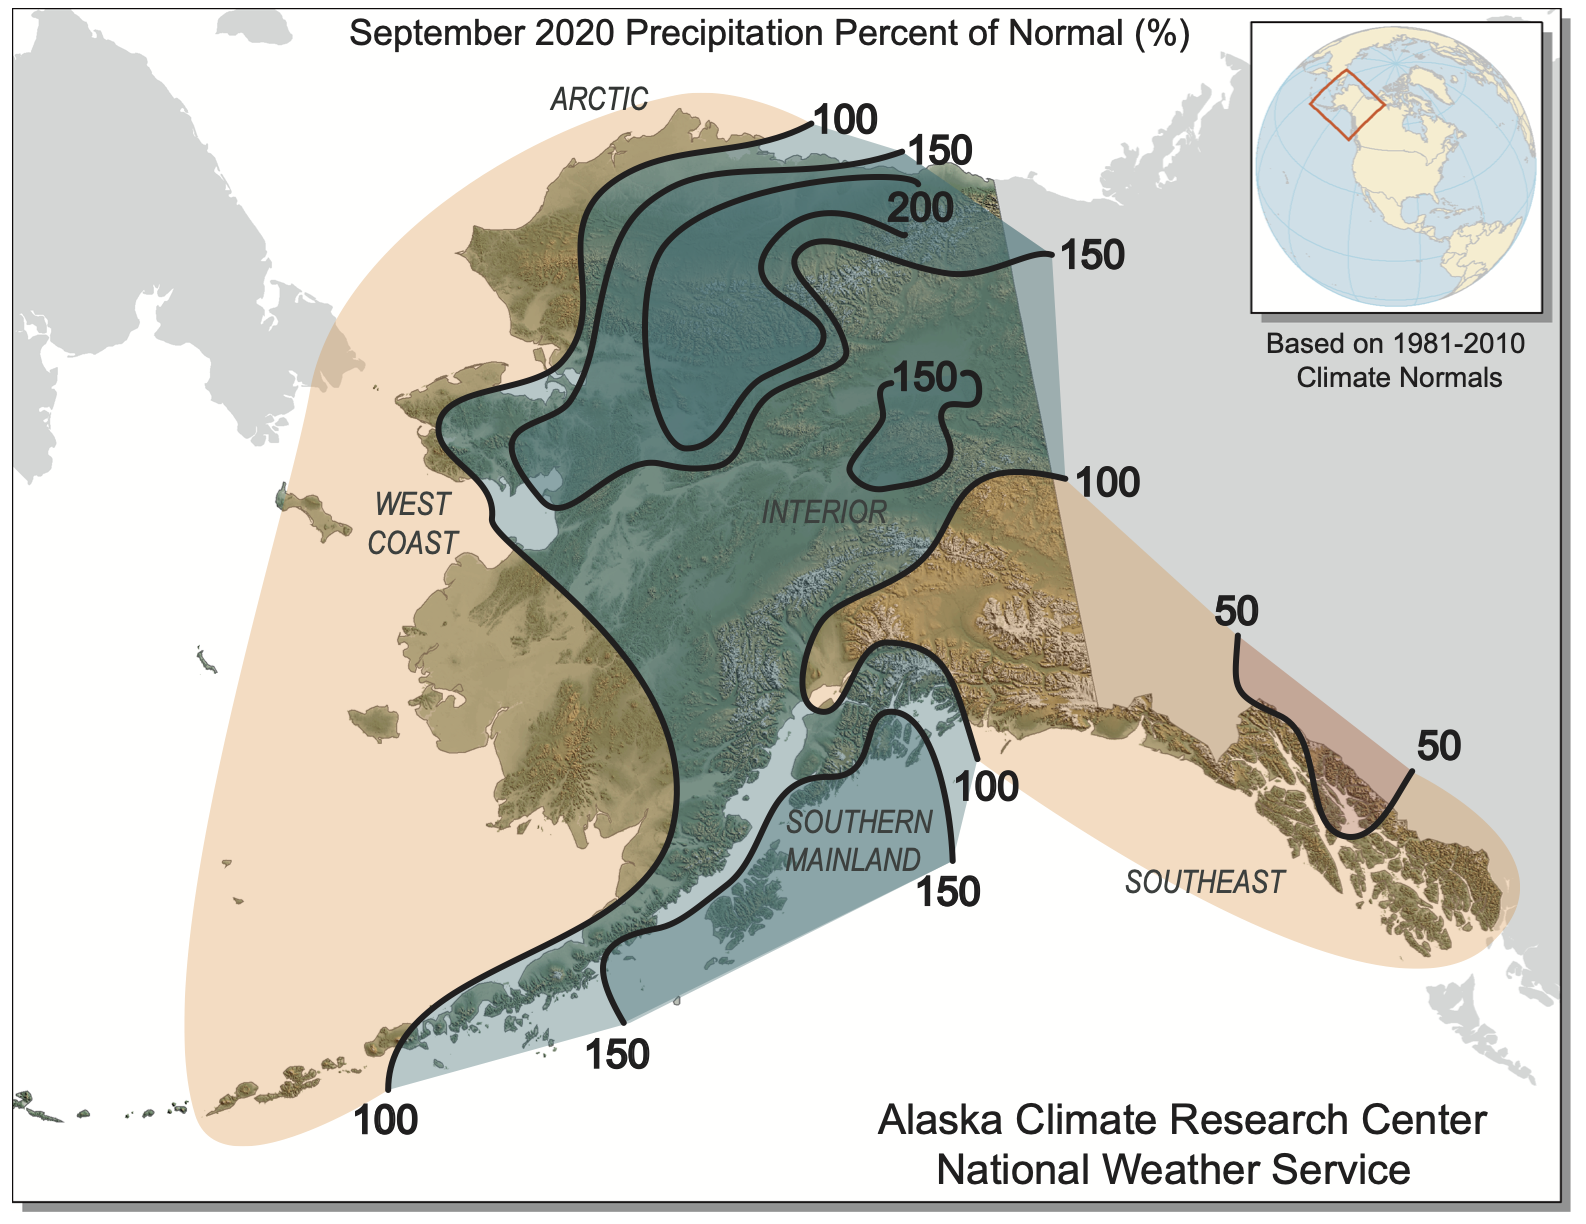
normal (1981-2010), September 2020.
precip anomaly map
WeatherWise precipitation anomaly map for September 2020.