Update January 2023: Our annual report is available here.
As 2023 draws to a close, we are compiling our annual review of weather and climate in Alaska. Our reviews are based on weather station data, which show the conditions at the specific location of each station, as well as spatially aggregated data products that provide additional information at a regional scale. Station data is typically available in near-real time, while gridded or regional data products have a lag of a few days to up to about a week. Below is an overview of the year to date (December 28).
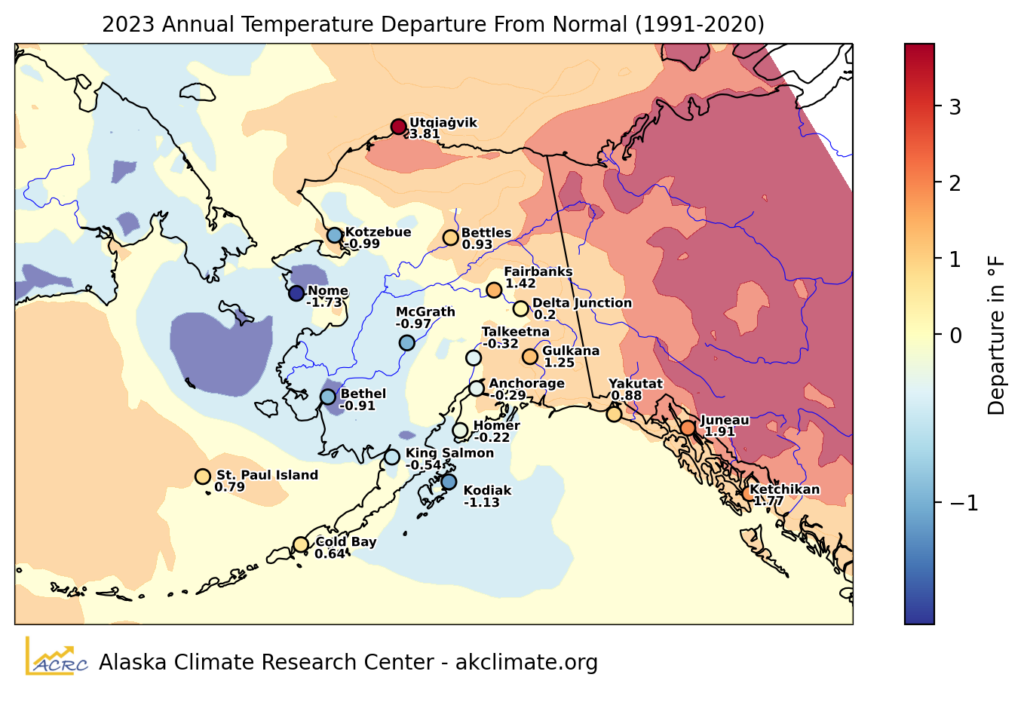
The First Order stations show a split pattern of mean annual temperatures (MAAT) with warmer than average conditions in the north and east of the state and near normal or moderately cooler than average temperatures in the west and southwest. Utqiaġvik will once again top the list as the warmest of the selected stations in relative terms, with an annual deviation of near 4°F from the 1991-2020 normal. The Panhandle stations are next warmest with around 1.7-1.8°F above normal. Nome was the coldest station in 2023, relatively speaking, with about -1.8°F below normal.
In Utqiaġvik, 2023 looks to be the fourth-warmest year of the time series. There has not been a year with a negative deviation from the 1991-2020 normal since 2012 at the airport station. Most of the other First Order stations have had at least one or two cooler years in the last decade.
Breaking temperatures down by month, February and April stand out as very cold and January and November were very warm. Variations of the pattern of cooler weather in the southwest and positive deviations in the north and east can be seen e.g. in May, September, and very strikingly in December.
Annual precipitation shows large regional variations. Utqiaġvik again stands out as very wet, along with Kotzebue, Nome, and some of the South-central stations. Considering monthly precipitation, we see that the North Slope frequently had wetter than average conditions. March brought some very wet conditions in the northwest. The prolonged cold snap in western Alaska in April coincided with very dry conditions since colder air masses can hold less moisture.
Finally, a brief look at the four First Order Stations with long term records of snow depth: The Juneau airport station is well below average and struggling to build up a seasonal snow pack. Bettles is near average and Fairbanks is a little above. Anchorage is having the second exceptional snow season in a row. Major storms in November and December set new records, although snow depth decreased by over 10 inches in between storms due to warm temperatures and rain during the second half of November. Snow depth is currently hovering around 25 inches, slightly below the time series maximum for the time of year.
We will publish our annual report with additional graphics and statistics in early January. Happy New Year to all!


